
It is a common financial practice to compare investment returns to a benchmark in order to evaluate performance. Most investors impulsively compare their portfolios to those indexes the financial news outlets commonly report on such as the Standard & Poor’s 500 Index and the Dow Jones Industrial Index. The problem with this is these indexes were designed to track the fortunes of large American companies only, not the average investor’s diversified portfolio.
The S&P 500 is made up of the 500 largest corporations listed on the New York Stock Exchange. It would make sense to use it to track the performance of the U.S. large company stock portion of your portfolio. But usually your portfolio contains other asset classes too, such as small company equity, international equity, and bonds. These asset classes within your portfolio are not included in the composition of the S&P 500, so comparing them to it does not make much sense; e.g. comparing a U.S. stock to an international stock would not be an apples-to-apples comparison.
The Dow is made up of 30 significant stocks trading on the New York Stock Exchange and the NASDAQ. Initially, this index included just 12 companies that were industrial in nature. Much like the S&P 500, comparing your diversified portfolio to an index made up of 30 stocks does not make sense either.
Here is an example what happens when an investor benchmarks his diversified portfolio against a commonly used index:
Joe is listening to the news. He hears that the S&P 500 has returned 11.96% for 2016. He opens up his year-end portfolio statement and sees that his portfolio returned 9.57% for the same period. He calls his financial advisor anxiously wondering why his portfolio did not meet or beat the S&P 500. His advisor explains that only 25% of his portfolio is invested in U.S. large company stocks. What’s more, only 60% of his portfolio is in the stock market – the rest is in bonds to properly diversify his portfolio against risk.
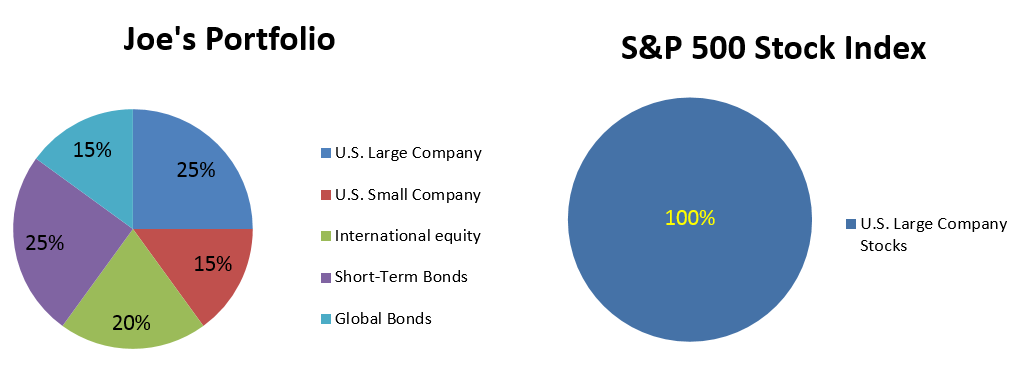
Joe’s stock portfolio is made up of 25% U.S. large company stocks. His portfolio captured 80% of the S&P 500’s return while only exposing 25% of his investments to U.S. large company stocks. Joe’s use of several asset classes is designed to protect him from market volatility in both good times and bad. It is designed to perform over the long-run. Note that although Joe’s portfolio did not beat the S&P 500 in the example above, in real life it is common for diversified portfolios to beat that index at times. Even when that happens it is unfair to compare the portfolio to the narrow index.
There are two main components that must remain the same in order to fairly compare your diversified portfolio to that of an index.
1) The type of index must be the same: you must use a U.S. stock index to compare the performance of the U.S. stock portion of your portfolio; it must be apples to apples.
2) The time period for returns: to compare the 2016 returns of your portfolio you must use the 2016 returns of the index.
If you have a diversified portfolio, comparing it to an index may not be the best way to evaluate returns. A well-diversified portfolio contains an allocation to many asset classes. An index is not set up to track multiple different asset classes; therefore it is unfair to compare your portfolio’s returns to that of an index. Your portfolio is unique to your lifestyle and financial goals; indexes do not have financial goals in mind. Indexes also do not incur fees; your individual portfolio will. These can be expense fees, management fees, 12b1 fees, etc.
We recommend investors ask a CERTIFIED FINANCIAL PLANNERTM professional for help with comparing their performance. They often will have software that can quickly and efficiently compare returns for you to provide a better evaluation of performance and provide recommendations on asset allocation to suit your risk tolerance. In addition, they will usually provide you with returns that are net of any fees, which will give you a true picture of your real net return.
Alanna Conciardo
Financial Planning Associate