It’s understandable that U.S. investors focus so closely on the domestic investment market; after all, it is the largest and one of the oldest in the world. But to do so in this day and age is to miss the wealth of opportunities for excess profits and risk reduction available by investing in international stock and bond markets.
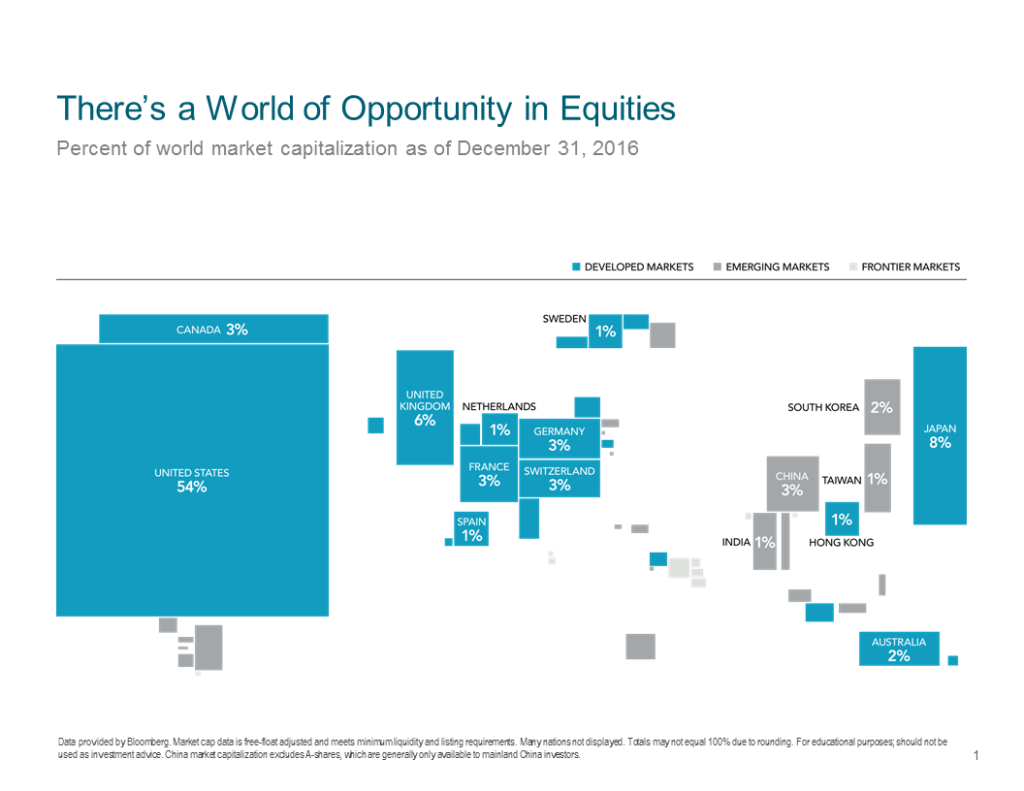
It’s easy to argue that those who invest everything solely in the United States are getting only about half of the world’s potential investment returns. Consider the chart above, which shows the size of each country’s stock market, based on its percentage of the world’s stock market capitalization.
As of the end of 2016 stocks listed in the United States added up to 54% of the world’s stock market wealth. Domestic-only investors missed out on opportunities in the other 46% of the world stock market.
Japan was the second largest stock market, with 8% of stock wealth, followed by the United Kingdom at 6%. Incidentally, even though China’s economic growth has attracted a lot of attention in recent years, its stock market was only 3% of the world’s stock capitalization.
The fixed income market is even more diverse:
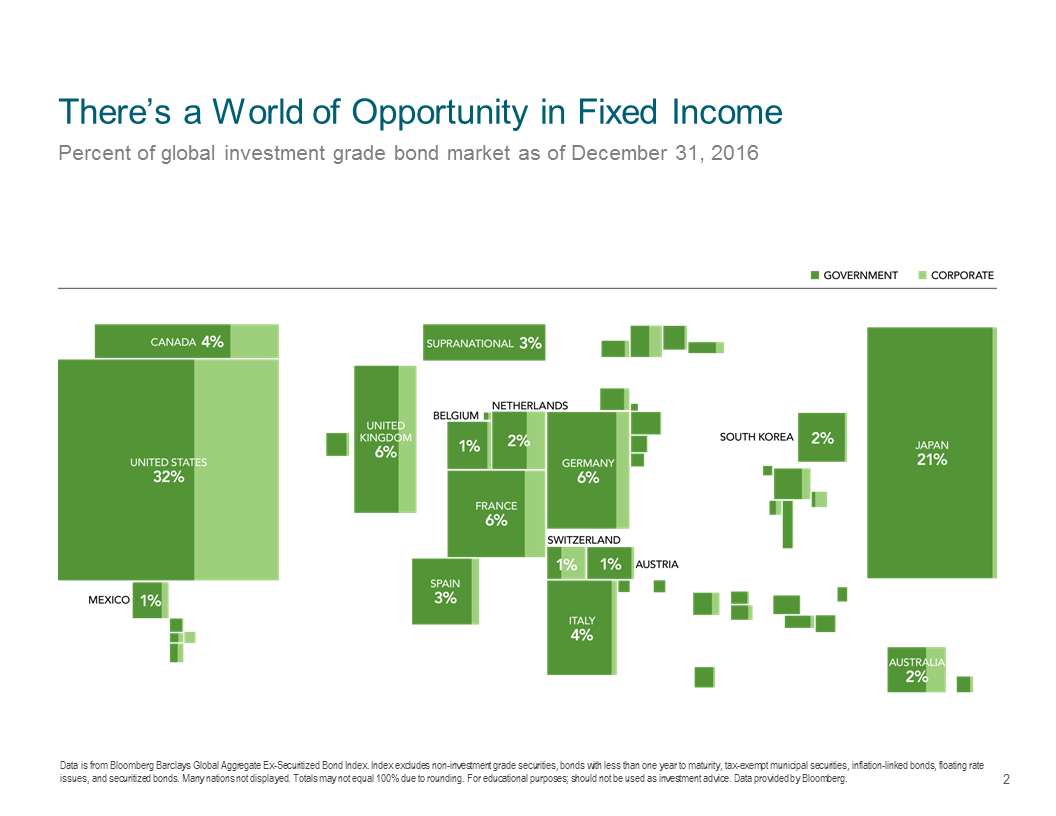
The United States accounts for only about one-third of the world’s investment grade bond market. Japan follows at 21%, or almost a fifth of the world’s total bond capitalization. Other countries that have relatively small stock markets, such as Italy, have more significant bond markets.
As you would imagine, returns on international markets vary widely depending on currency fluctuations, corporate profitability, innovation, global trade, local resources and productivity, politics, weather, war, and other factors. That’s what makes global investing so appealing: you can’t predict year to year which markets will be profitable, but by having some money in each one you can guarantee you will profit when individual markets rise. The converse is also true: by having your money sprinkled around, you will avoid having everything in the one market that lags behind everyone else.
The chart below shows yearly investment returns since 1997 for each of the developed international markets, including the United States on the bottom line. Each year’s winning stock market is highlighted:
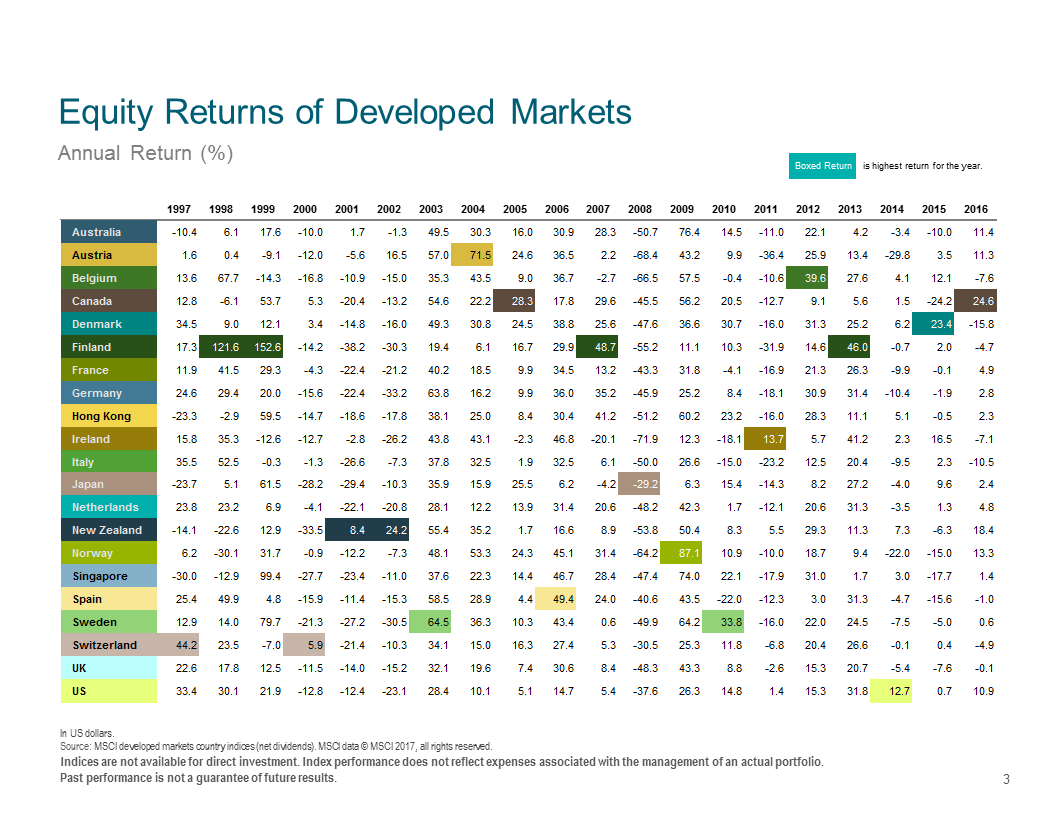
It may surprise you that since 1997 the U.S. stock market has been the top performer only once, when it returned 12.7% in 2014. Last year we were beaten handily by our neighbor to the north, when Canada’s market returned 24.6% compared to our 10.9%.
The power of a globally-diversified portfolio really shows up over the long term. In the chart below, a globally-invested stock portfolio modelled by Dimensional Fund Advisors is compared to the U.S. Standard & Poor’s 500 Stocks index and an index of short-term U.S. Treasury bills:
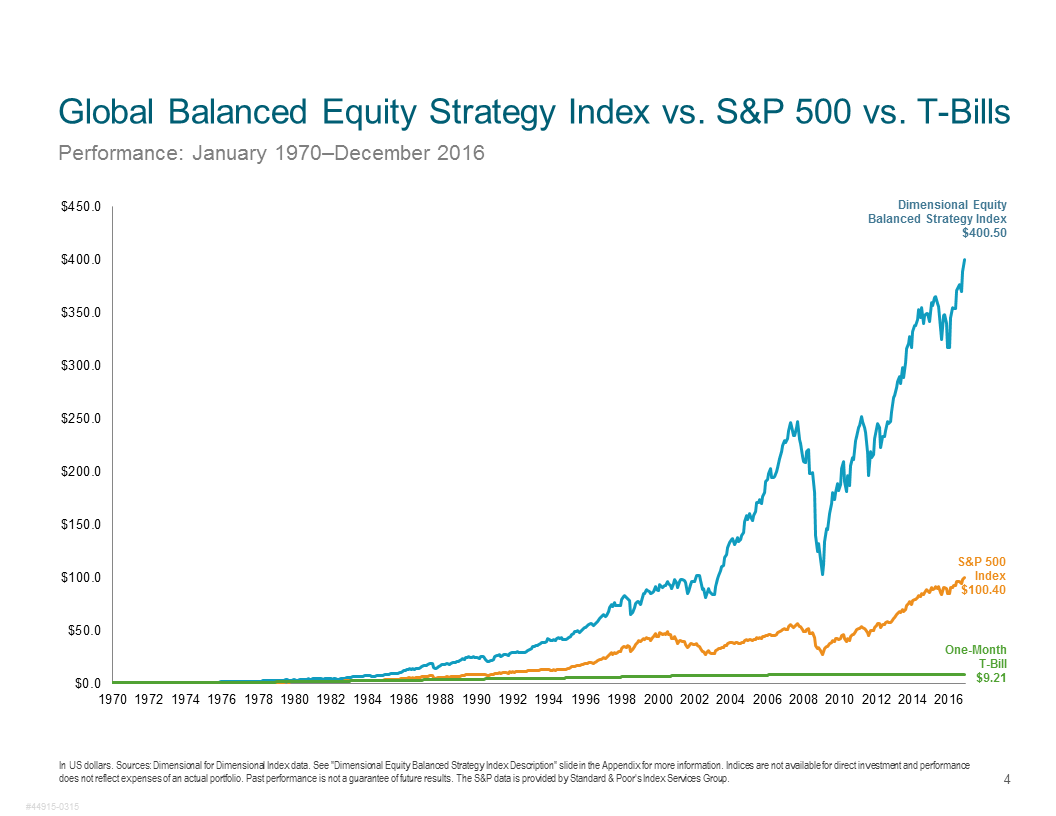
Note how the world-wide stock portfolio far outpaced a U.S.-only stock portfolio from 1970 through 2016. A dollar invested in the S&P 500 in 1970 grew to $100.40 over the period, while a dollar invested in the global portfolio (which included a large allocation to U.S. stocks), grew to $400.50.
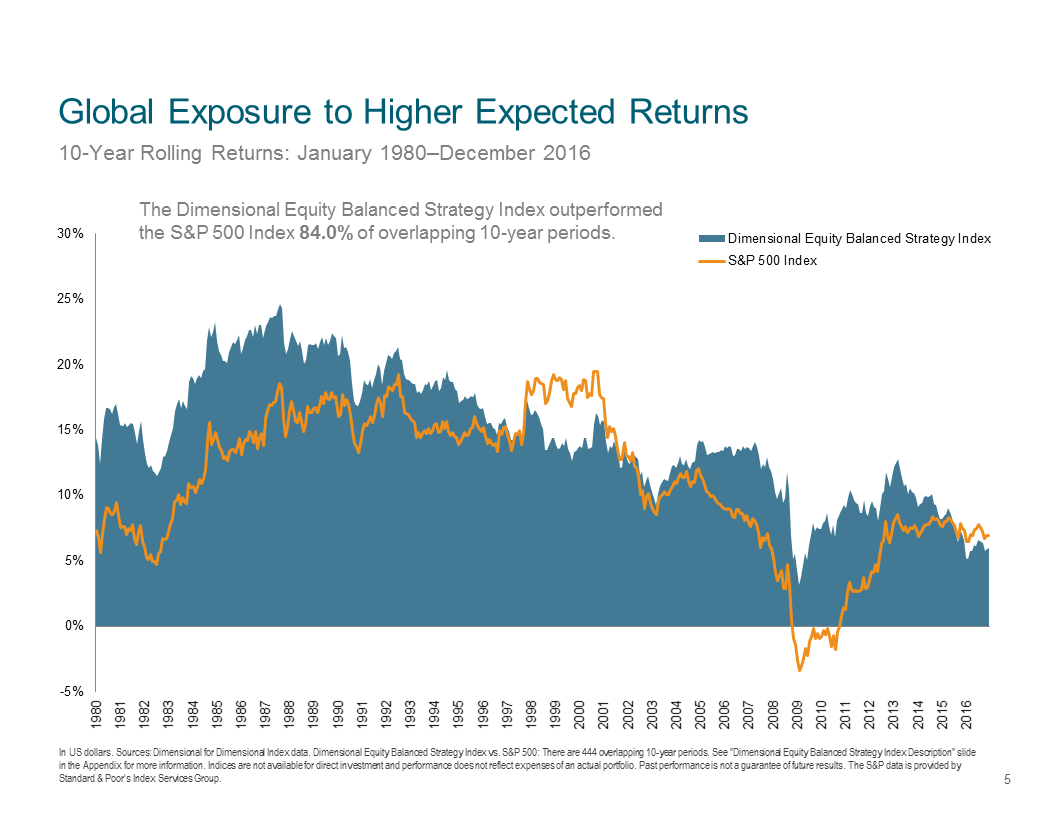
Investing in the United States and internationally is no guarantee of beating the U.S. market during any specific period. However, since 1980 it looks like a global portfolio has done better than a U.S.-only strategy 84% of the time:
For those who are curious, here is a description of the global portfolio used in the illustrations above, along with a description of the indexes used to track its performance over time. We think it is worth noting that although this portfolio invested internationally, it still kept 70% of its assets in U.S. stocks: