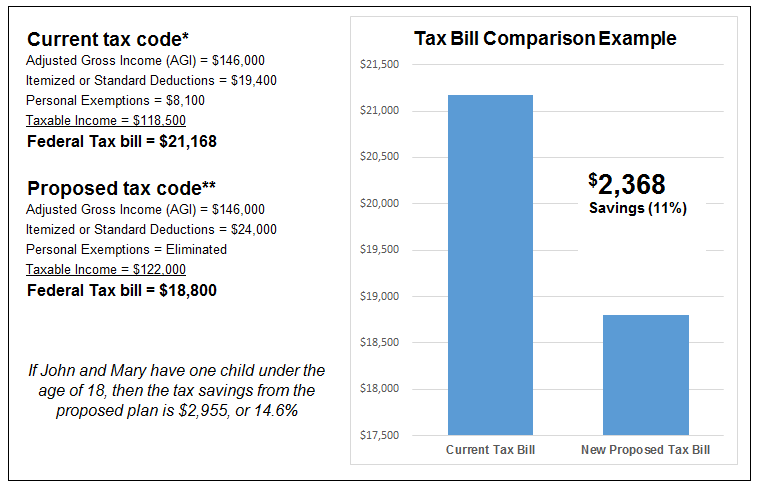
On Thursday, the GOP announced details of their tax reform proposal. The proposal provides additional details on the tax package they intend to implement. And for the first time they released the actual brackets for each tax rate, which is incredibly important when trying to figure out if you will be better off under the new plan or not. Let’s dive in to a comparison for one family.
John and Mary Smith are both working, age 58 and have no children. John is earning $75,000/year and contributing $10,000/year to his 401k. Mary is earning $105,000/year and maxing out her 401k ($24,000/year). For simple rounding purposes, let’s say they pay $9,400/year in New York state income taxes, $4,000/year in property taxes and $6,000/year in mortgage interest.
Here is how it shakes out under the current tax structure and under the proposed tax structure:
As you can see, the width of each tax bracket is incredibly important. The consolidation of brackets and slight reduction in rates may help offset some of the lost deductions and exemptions for many taxpayers.
Any time there are changes to the tax code there will be winners and losers. As always, if any tax reform legislation is passed, we will evaluate and provide commentary on the final details so you know how you will be affected.
Steven Elwell, CFP®
Partner & Vice President
Sources and notes:
*Using Bankrate.com’s 2016 tax calculator
**Using MarketWatch’s Trump tax calculator
Disclaimer: These are tax projections for example purposes only. Level Financial Advisors will not be held liable for any mistakes or errors in this cited article’s calculations. This is not intended to be tax advice or financial advice. Please consult your financial advisor or tax advisor when doing your own taxes.


